
Harnessing Data to Uncover Customer Insights
A Journey into Advanced Segmentation

In an era where every interaction leaves a digital footprint, businesses are increasingly turning to data to better understand their customers. Each purchase, click, and engagement generates valuable information that, when properly analyzed, can reveal deep insights into customer behaviour. However, the challenge lies in sifting through this vast amount of data to extract patterns that truly matter. This is where customer segmentation becomes essential—a technique that categorizes customers into distinct groups, allowing for more targeted marketing and improved customer relationship management.

Project Overview
In this project, we embarked on a comprehensive analysis to segment customers based on their purchasing habits, loyalty, and overall value to the business. The goal? To uncover actionable insights that can drive more effective marketing strategies and enhance customer engagement. From initial data exploration to advanced clustering techniques, this blog post takes you through our process, the challenges we faced, and the valuable insights we discovered along the way.
The Challenge: Understanding Customer Behaviour
Our project started with a clear objective: to segment customers based on their purchasing behaviour, loyalty, and overall value to the company. By breaking down the customer base into distinct segments, we aimed to uncover actionable insights that could drive more effective marketing strategies and enhance customer engagement.
Diving Into the Data
The dataset we received was rich with transactional details, including everything from customer demographics and purchase history to loyalty metrics. But as is often the case with real-world data, it wasn’t all smooth sailing. Initial exploration revealed the presence of outliers—those pesky data points that don’t fit the pattern of the rest of the data. Outliers can distort the results of any analysis, so our first task was to identify and manage these anomalies.
We employed several methods, including the Interquartile Range (IQR) and Isolation Forest techniques, to pinpoint these outliers. This step was crucial to ensure that our data analysis would accurately reflect the typical customer experience, rather than being skewed by outliers.
Engineering Features That Matter
Once the data was cleansed, we moved on to feature engineering. This involved creating new variables—or features—that could better capture the nuances of customer behaviour. Some of the key features we engineered included:
Frequency: The number of unique orders a customer has placed.
Recency: The number of days since a customer’s last purchase.
Customer Lifetime Value (CLV): The total revenue generated by a customer over their relationship with the company.
Average Unit Cost: The average cost of items purchased by the customer.
Customer Age: Calculated from their birthdate.
Loyalty Score: A metric reflecting the customer’s engagement with the brand.
These features provided a solid foundation for our next step: clustering.
Clustering Customers with Machine Learning
To segment the customers, we used the K-Means clustering algorithm—a popular method in the field of unsupervised machine learning. But how many clusters should we create? To answer this, we tested different values of k and evaluated the results using inertia and Silhouette scores, eventually identifying four distinct customer groups.
Cluster 1: High-value, loyal customers who frequently engage with the brand.
Cluster 0: Lower-value customers who might require more attention to increase their engagement.
Cluster 2: Customers with moderate engagement, representing potential growth opportunities.
Cluster 3: Recently re-engaged or new high-potential customers.
Each of these clusters offers unique insights into customer behaviour, allowing for tailored marketing strategies that address the specific needs and preferences of each group.
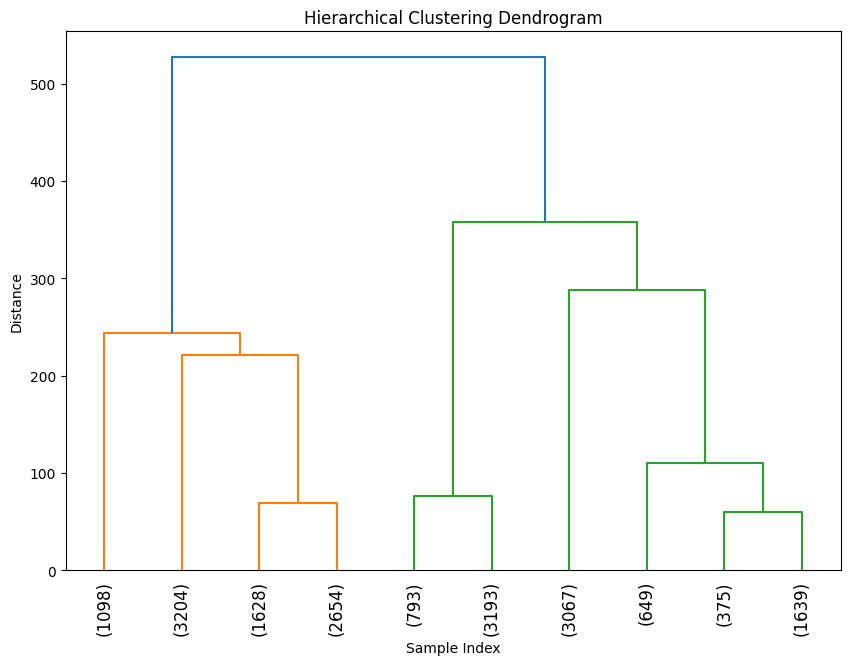
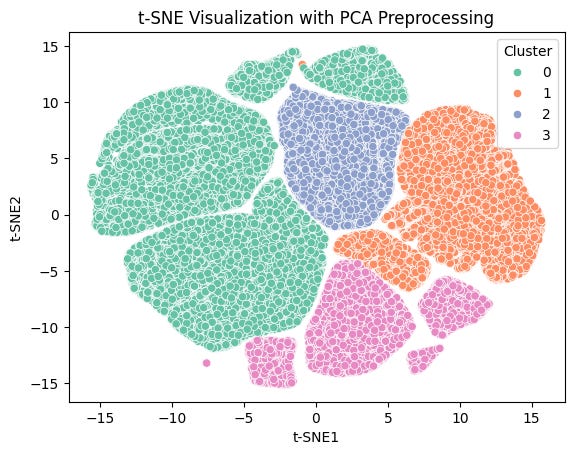
Seeing the Big Picture: Dimensionality Reduction
To visualize these clusters, we applied dimensionality reduction techniques like PCA and t-SNE. These methods helped us condense the complex, multi-dimensional data into 2D plots, making it easier to interpret the relationships between different customer groups.
Key Insights and Takeaways
Our analysis revealed several critical insights:
High CLV Customers: Cluster 1 emerged as the most valuable segment, with customers who frequently purchase and have high lifetime values. This group should be a primary focus for loyalty programs and premium services.
Engagement Opportunities: Cluster 0, while less engaged, represents an opportunity for growth. Targeted campaigns could help increase their spending and loyalty.
Understanding Customer Value: The strong correlation between Frequency and CLV underscores the importance of regular customer engagement. Conversely, Recency’s negative correlation with CLV suggests that the most recent customers may not yet be as valuable, likely due to their shorter relationship with the brand.
Conclusion: Data-Driven Decisions for Better Customer Relationships
This project highlighted the power of data in driving smarter business decisions. By segmenting customers based on their behaviour and value, we can craft more effective marketing strategies that not only meet the needs of the business but also enhance the customer experience. The insights gained from this analysis provide a clear path forward—one where data-driven decisions lead to stronger customer relationships and, ultimately, greater business success.
new to the space and learning from Sheldon's posts.
Very useful resources.